The formal project to build analytic capabilities within ASR closed the end of FY21. The amazing work continues in the Student Data Analytics team and a new analytics website was rolled out at the end of September 2021.
The Student Success Analytics (SSA) initiative will positively affect and support student success throughout the University of Minnesota by understanding and utilizing data and analytics. The goals of this initiative include:
- Increase student retention and timely graduation
- Improve curricular design, delivery, and transparency
- Lower average student debt upon graduation
- Enhance the student academic experience
The SSA initiative will continue to build on the progress of existing University best practices like degree-planning resources and dashboards for students and advisors (APAS, APLUS), promoting financial wellness, career bridging, risk segmentation, peer mentoring, and campus engagement.
The work will initially focus on undergraduate students; opportunities for the University's graduate and professional students are being assessed.
Student Success Analytics dashboards

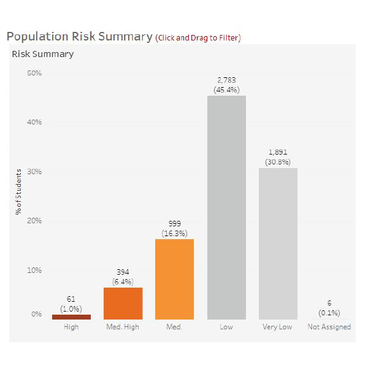
The Retention Risk Dashboard visualizes retention risk levels for cohorts of students based on user-selected filters. The dashboard groups students into "risk levels" based on whether students are at "high," "medium-high," "medium," "low," or "very low" risk of leaving the University system by the start of the next academic term. The dashboard also allows the user to switch to a student-level detail view that provides additional contextual information for individual students.

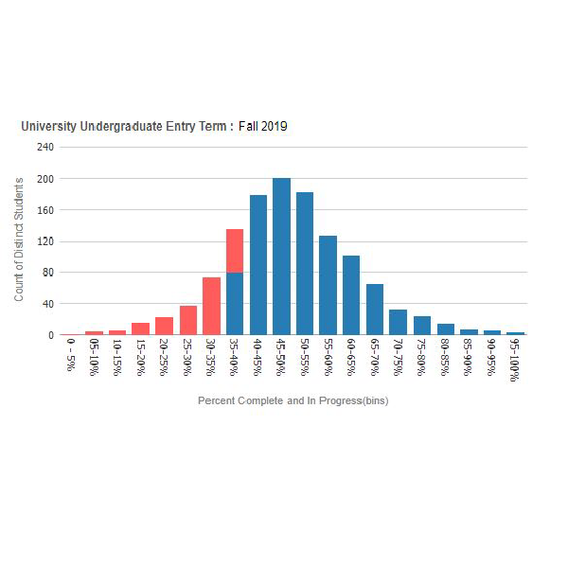
The Undergraduate Degree Progress Dashboard gives an aggregate and student-level view of undergraduate student degree progress. It shows how students are progressing toward their degrees based on the percent of required degree-applicable credits they have completed. The color coding identifies which students are "on track" to a 4-year graduation for New High School (NHS) or 3-year graduation for New Advanced Standing (NAS) students. The dashboard also allows the user to switch to a student-level detail view that provides additional contextual information for individual students.

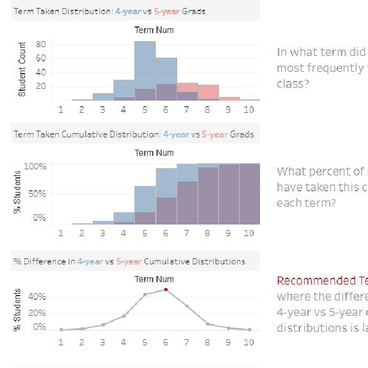
The Recommended Term Dashboard analyzes the historical course-taking patterns of New High School (NHS), undergraduate students who earned their degrees in 4 vs. 5 years. For each of a college's plans or subplans, the dashboard recommends the latest term in which a student should take a particular class to be able to graduate in 4 years.
The data is considered a private student education record under the Board of Regents policy on Student Education Records and is classified as "Private - Restricted" under the University Data Security Classification policy.
Project information
Project timeline and status
View the current project status
Project work and deliverables generally flow through the following phases, including the iterative nature of the work as new features are requested.
Discovery
Identify a problem. Gather and analyze information to understand the stakeholders’ and end users’ goals and needs to solve that problem.
Requirements Gathering
Identifying and documenting requested requirements from stakeholders.
Proof of Concept/Prototype
Determines if an idea can be turned into a reality that will function as envisioned. Generally delivered as prototyping or wireframing samples demonstrating the design concept feasibility. Used to gain stakeholders feedback and insights in product iterations.
Minimum Viable Product
The MVP is released in a production environment to attract early-adopters with enough features to satisfy customer needs. Typically MVP involves a soft launch to test the functionality allowing adjustments to be made before a wider release.
Implementation
The production release of a new product communicated to the designated audience with training and job aids provided.
Operations sustainability
The transition of a product to operations support to encompass continual improvement.
Project deliverables and tool descriptions
Retention risk predictive analysis
Effort to model and analyze whether an individual student is at risk of leaving.
Curriculum analysis
Effort to analyze historical course-taking patterns to make curricular recommendations.
Degree progress reports
Ability for data authors to independently answer student degree-progress questions.
Degree progress dashboard
Dashboard will aggregate and provide summary-level degree progress data and information.
Graduation proximity report
Report provide student-level progress toward completion information.
Retention rate dashboard
Dashboard to provide summary- and student-level retention rate information.
Graduation rate dashboard
Dashboard to provide summary- and student-level graduation rate information.
Student retention risk dashboard
Dashboard to provide summary- and student level retention risk information.
Major-change analysis
Effort to understand impact of major changes, outcomes, and pathways to success.
Project governance
Executive sponsor
Bob McMaster, OUE
Business sponsor
Sue Van Voorhis, ASR
Project lead
John Vlk, Student Data and Analytics, ASR, OUE
Steering committee members
- Sue Van Voorhis, Associate Vice Provost and University Registrar, ASR, OUE
- Peter Radcliffe, Director of Undergraduate Analytics, OUE
- LeeAnn Melin, Assistant Dean for Undergraduate Student Initiatives, OUE
- Brian Krupski, Enterprise Data & Analytics Service Owner, OIT
- Linc Kallsen, Director, Institutional Analysis, OBF
- Beth Lingren Clark, Associate Vice Provost of Strategic Enrollment Initiatives
Working groups
- College leadership (Deans, Associate Deans, and Advisor Management/Student Services directors)
- Advisors
Additional resources
Support
If you have questions or feedback, please contact the ASR's Student Data and Analytics team at asrstudentdata@umn.edu.